Did you have a good year?
If your team is anything like ours, you’re probably spending some serious time reflecting on the year that has been and planning on what 2015 can bring. Last week, I’ve spent lots of time diving into reports and doing the analysis that we didn’t make time for during the year.
At various points this year, I’ve found myself guilty of focusing on just making the end of the week… or month or even quarter. It’s incredibly important to reflect on what progress has really been made over the last twelve months — or what might be possible over the next twelve.
One click
When we describe GoSquared to potential customers, we frequently describe Trends as one click web analytics. A key philosophy behind GoSquared is that you should be able answer questions and get information about your audience as quickly as possible. Trends in particular gives you insights in one click, whether that’s for a day, week or month.
Like us, you should be thinking about the coming year and how you can make sure 2015 is off the charts. We wanted to help with that. If one of your burning questions right now is how did 2015 go?, then our answer is just one click away.
How did the year go?
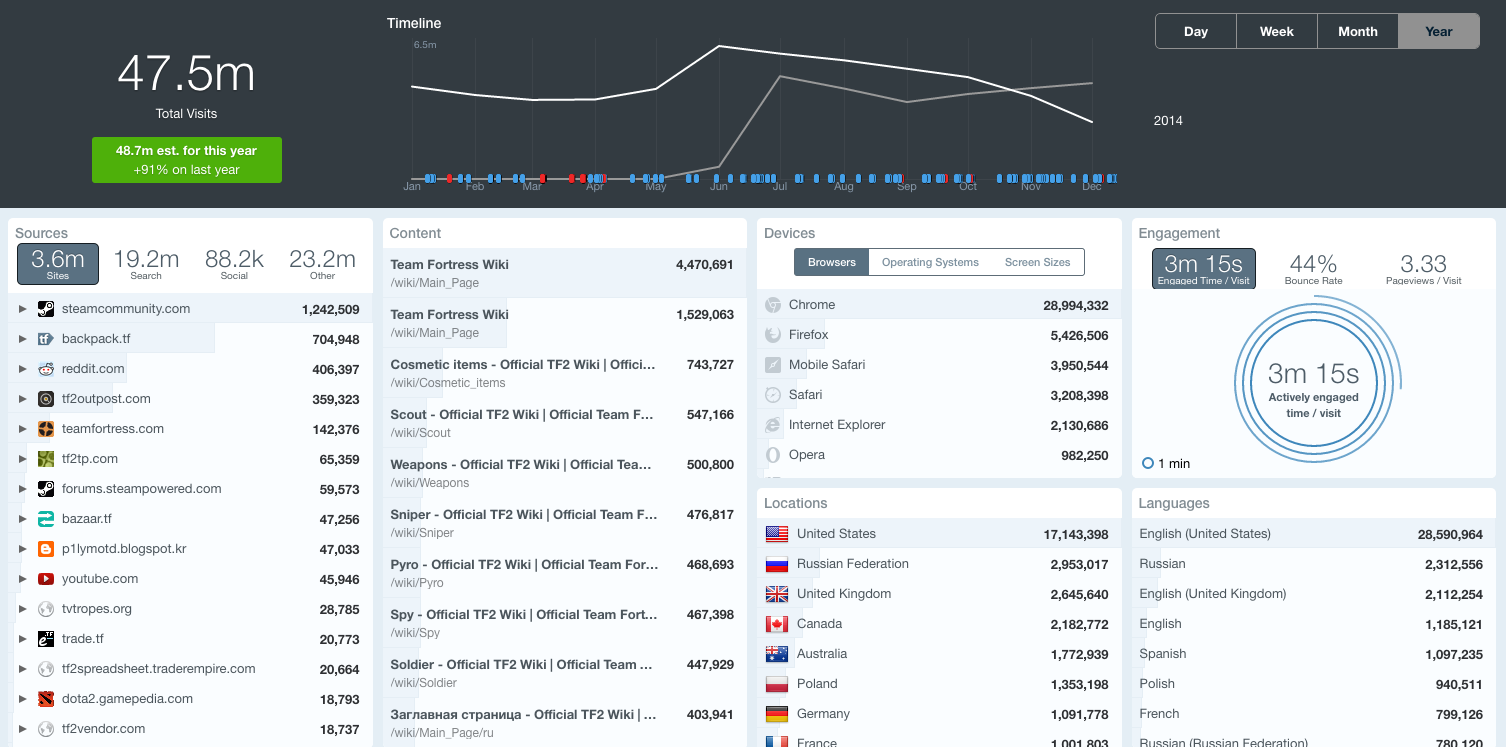
We’ve just launched year view in Trends. If you head to your dashboard, you’ll find a new time frame option for
You’ll find some interesting insights about your trends across the year and it will raise some questions you might want to think about. Even better, cross check GoSquared data with other sources to build a richer picture of 2014.


